How to Make Infographic Videos from Data

Make infographic videos from data with a worked dataset, storyboard, narration, and checks for scales, units, and claims.
A chart can be correct and still lead viewers toward the wrong conclusion. The title, scale, order, and narration all influence what they think the data means.
Learning how to make infographic videos starts with choosing a question the data can answer. Then you can build a sequence that shows the relevant values, explains the comparison, and keeps its limits visible.
This guide uses a fictional support-queue dataset to demonstrate the process. The figures are invented for teaching. They are not customer results, a performance benchmark, or evidence about Felo.
Find the question before the chart
A spreadsheet may contain dozens of columns. A video needs a reason to show a particular relationship.
For our example, the question is: Did the share of requests resolved on the same day improve?
That is more precise than "How did support perform?" The broader question might involve response quality, complexity, staffing, satisfaction, and other measures the dataset does not contain.
Here is the complete source table:
| Month | Total requests | Resolved the same day | Same-day resolution rate |
|---|---|---|---|
| April | 400 | 280 | 70% |
| May | 500 | 350 | 70% |
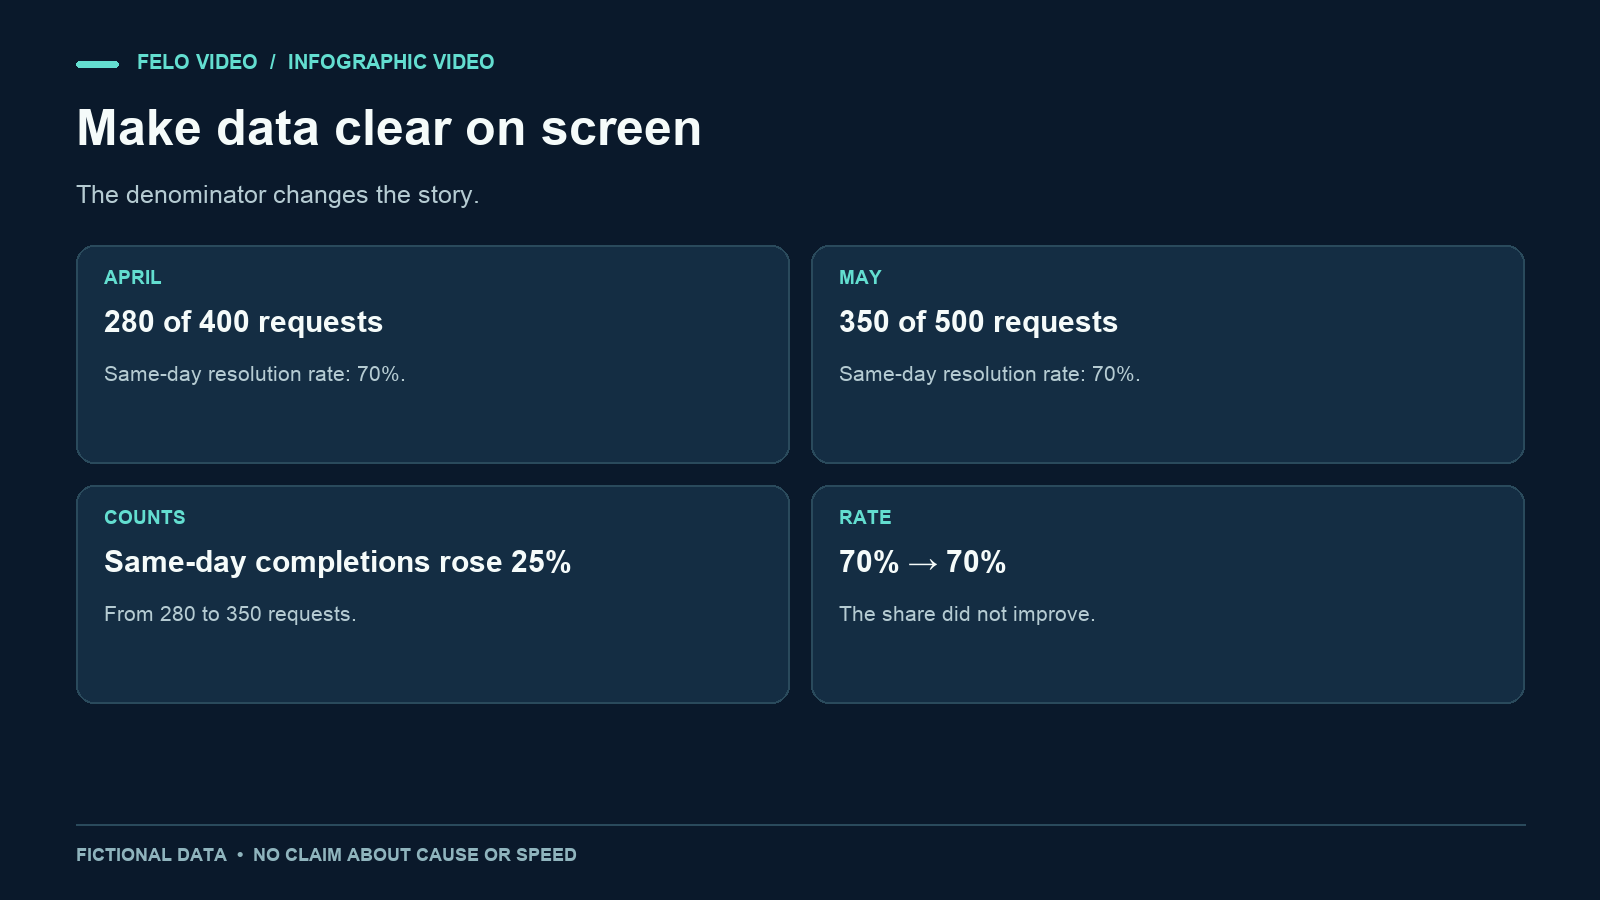
Both same-day counts are correct, and both rates are correct. The story changes depending on which comparison you emphasize.
The number of requests resolved on the same day increased by 70, from 280 to 350. That is a 25% relative increase. Total requests also increased by 25%, from 400 to 500. The same-day resolution rate stayed at 70%.
A headline such as "Support became 25% faster" would go beyond the data. The table does not measure speed as elapsed time, and it does not show a rate improvement.
Write the conclusion in plain language
Before designing an animation, write the strongest supported conclusion:
The team handled more requests and resolved more of them on the same day, while the share resolved that day stayed at 70%.
Then write the limit:
The data does not explain why volume increased or how the quality and complexity of the requests changed.
These two sentences keep the project focused. You can use them to evaluate every proposed title, scene, and spoken line.
Distinguish observations from explanations. "The rate stayed the same" is an observation from the table. "A new workflow prevented the rate from falling" would be an explanation requiring more evidence.
That distinction matters in a short video because an audience may remember the headline more readily than a small note at the end. Put the qualification near the claim it changes.
Choose a visual form that matches the comparison
For this dataset, a sequence of simple charts is easier to inspect than one crowded dashboard.
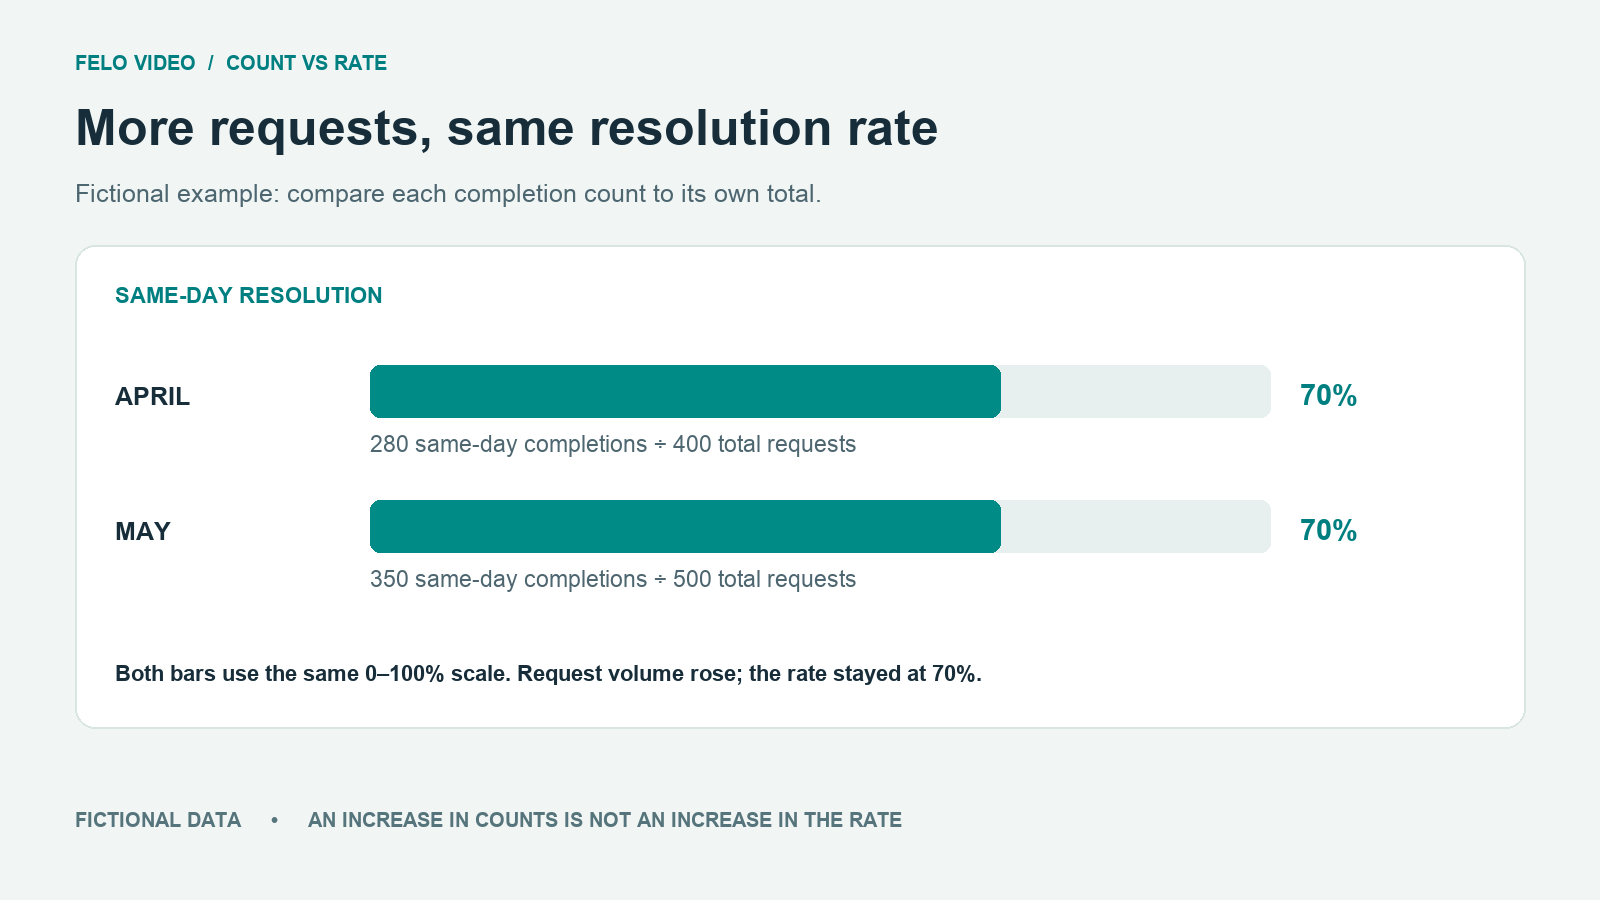
Use ordinary bars to compare total counts across months. Use two identical-length percentage bars to compare rates. Keep the labels explicit so viewers do not confuse counts and percentages.
| Question | Useful visual | Important constraint |
|---|---|---|
| Did request volume change? | Two count bars | Same zero baseline and count scale |
| Did same-day completions change? | Two count bars | Label the measure as completed requests |
| Did the rate improve? | Two percentage bars | Same zero-to-one-hundred-percent scale |
| What does the pattern mean? | A short summary beside the table | Do not add a causal explanation |
A pie chart would not be the first choice for comparing these two months. It can show parts of a whole, but separate pies can make small comparisons harder to inspect. A simple labeled bar gives the viewer a direct reference.
For other datasets, choose the chart based on the relationship. A time series may call for a line. A process may call for a flow diagram. A ranking may need sorted bars. Felo's Japan Births Data Story is an example of presenting a data topic as a video; check its source and time period before drawing conclusions from it.
Plan the infographic video scene by scene
The order should help viewers understand the comparison without having to revise a misleading first impression.
Scene 1: introduce the question
Show the title "Did the same-day resolution rate improve?" with the two months beneath it. Label the material "Fictional example data."
The title names the measure. It does not announce improvement before the evidence appears.
Scene 2: establish the total volume
Show April at 400 requests and May at 500. Keep the baseline and scale unchanged. Let viewers see that the workload increased.
Avoid changing the size of decorative icons in a way that implies a larger difference than the values. If you use one icon per fixed number of requests, explain the unit and keep it consistent.
Scene 3: show the same-day counts
Show 280 and 350 same-day completions. Keep the month order consistent with the previous scene.
At this point, the video can say more requests were resolved on the same day. It should not yet use that fact as a synonym for better performance.
Scene 4: bring in the denominator
Display 280 divided by 400 and 350 divided by 500. Both produce 70%. Use equal percentage bars or clearly labeled fractions.
This is the explanatory center of the video. Give it enough time. A fast transition from the counts to the rates can hide the reason the conclusion changes.
Scene 5: state the conclusion and limit
Show the two plain-language sentences: volume increased; the rate stayed the same. Add a smaller but readable note that this dataset does not explain quality, complexity, or cause.
This storyboard is an editorial plan. It is not evidence that a generated video has already reproduced the charts correctly.
Write narration that explains the visual
Here is a complete sample narration:
In this fictional support log, the team received four hundred requests in April and five hundred in May. Same-day completions rose too, from two hundred eighty to three hundred fifty. That is more work completed on the same day. But did the completion rate improve? Divide each same-day count by that month's total. Two hundred eighty out of four hundred is seventy percent. Three hundred fifty out of five hundred is also seventy percent. The team handled a larger volume while maintaining the same rate. These figures do not tell us why volume changed, whether the requests were equally difficult, or how customers rated the answers.
The narration explains the relationship between the numbers instead of reading every element on the screen. The visible labels still matter because listeners may miss a spoken value.
Keep terminology consistent. Switching between "same-day completion," "instant response," and "speed" would make the video sound varied while changing the meaning. Repeating the correct measure is preferable.
Give the infographic video maker exact constraints
A prompt should include the table and the intended interpretation. Do not rely on an image of the chart alone when exact values are important.
Create an infographic video using the attached fictional dataset. Answer whether the same-day resolution rate improved. Show total requests, same-day counts, and then the rate calculation. Keep April before May throughout. Use zero baselines for count bars and a consistent percentage scale for rate bars. State that both rates are seventy percent. Label the data as fictional. Do not claim that the team became faster or that a workflow caused the change. Use readable labels, clear narration, and restrained motion.
Felo's Infographic Video Maker entry point is intended for explaining data, comparisons, and processes visually. Prepare the values and interpretation before using it, then compare the generated scene labels with the source table.
If you need exact chart styling or a particular source graphic, provide the relevant asset and review how it is used. Do not assume an uploaded chart will be reproduced without alteration.
Review arithmetic and visual meaning separately
First, check the numbers. Recalculate rates and percentage changes from the original table. Confirm that units, dates, and category definitions match.
Then inspect how the design presents them. Two correctly labeled bars can still mislead if their heights do not match the scale. A truncated axis can exaggerate a difference. A color change can suggest improvement even where the metric is unchanged.
Use a review record with a place for each of these checks:
- Values and calculations.
- Denominators and units.
- Axis range and baseline.
- Category order and time period.
- Narration and caption consistency.
- Source and limitation labels.
Watch the video once with the sound off. Does it still communicate the correct comparison? Then listen without looking at the screen. Does the narration support the same conclusion?
If those two versions tell different stories, revise the scene rather than expecting the audience to reconcile them.
For real data, include the source title, date or period, and a link where readers can inspect the method. Avoid placing a long URL in tiny on-screen text; a readable source label can accompany a full link in the surrounding page or description.
Keep a static copy of the source table available beside the video or in the accompanying article. A viewer who wants to inspect the numbers should be able to do so without pausing an animation at exactly the right moment. This also makes it easier to explain a later correction if a source value changes.
Questions about infographic videos
How many numbers should a short infographic video include?
Include the values needed to answer its question. The example uses two totals, two counts, and two rates because the denominator changes the interpretation. Adding unrelated metrics would make that relationship harder to follow.
Can I use a screenshot of a dashboard?
Yes, but inspect it at the final viewing size. You may need to crop or rebuild the relevant comparison with larger labels. Keep the data and meaning consistent with the original.
Is animation necessary?
Motion is useful when it directs attention or reveals a relationship in a helpful order. A readable static chart with clear narration can be more effective than a busy animation.
What if the data does not support an exciting conclusion?
Explain the supported result. An unchanged rate can still be useful information, especially when it corrects a tempting but unsupported claim.
Choose a question, prepare the source table, and explore Felo Infographic Video Maker.