Featured
Authorwory@ホッピング中
93 days agoVR Headset Exploded View Poster
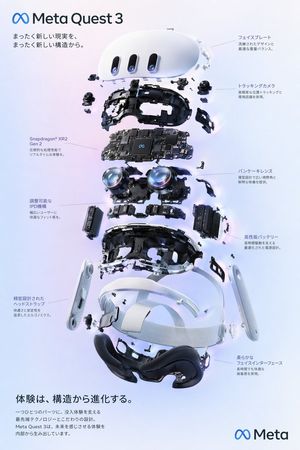
Generates a high-tech exploded view diagram of a VR headset with detailed component callouts and promotional text.
Prompt
{
"type": "exploded view product diagram poster",
"subject": "VR headset",
"style": "clean high-tech 3D render, studio lighting, glowing accents",
"background": "{argument name=\"background color\" default=\"soft purple and blue gradient\"}",
"header": {
"logo": "∞ {argument name=\"product name\" default=\"Meta Quest 3\"}",
"subtitle": "{argument name=\"main catchphrase\" default=\"A whole new reality, from a whole new structure.\"}"
},
"layout": {
"centerpiece": "vertically stacked exploded view of a VR headset showing 9 distinct layers of internal components: outer shell, camera sensors, motherboard with chip, pancake lenses, internal frame, battery packs, side straps, top strap, and facial interface cushion.",
"callout_labels": {
"count": 8,
"left_side": [
"Snapdragon® XR2 Gen 2\nOverwhelming processing power for real-time experiences.",
"Adjustable IPD Mechanism\nComfortable fit for a wide range of users.",
"Precision-engineered Head Strap\nErgonomics designed for comfort and stability."
],
"right_side": [
"Faceplate\nSleek design and optimal weight balance.",
"Tracking Cameras\nHigh-precision positional tracking and environmental awareness.",
"Pancake Lenses\nThin design providing a wide field of view and clear visuals.",
"High-performance Battery\nOptimized power design supporting long battery life.",
"Soft Facial Interface\nComfortable fit even for extended periods."
]
},
"footer": {
"left_text_block": {
"headline": "{argument name=\"bottom headline\" default=\"Experience evolves from structure.\"}",
"body": "Every single part features cutting-edge technology and meticulous design supporting immersive experiences. Meta Quest 3 creates a futuristic experience from the inside out."
},
"right_logo": "∞ Meta"
}
}
}